Lecture 6: The Efficient Frontier and Efficient Portfolios
1. Concept of the Efficient Frontier
The Efficient Frontier is a graphical representation of portfolios that offer the highest expected return for a given level of risk or the lowest risk for a given level of expected return. It represents the set of optimal portfolios that maximize returns for varying levels of risk.
-
Key Characteristics :
- Portfolios on the efficient frontier are considered "efficient" because they provide the best possible trade-off between risk and return.
- Portfolios below the efficient frontier are suboptimal as they either offer lower returns for the same level of risk or higher risk for the same level of return.
-
Graphical Representation :
- The x-axis represents portfolio risk (standard deviation).
- The y-axis represents portfolio return.
- The efficient frontier is a curved line that starts from the minimum variance portfolio and extends upward, indicating increasing returns with increasing risk.
2. Identifying Efficient Portfolios
Efficient portfolios are those that satisfy one of the following conditions:
-
Maximum Return for a Given Level of Risk :
For a specific level of risk (), an efficient portfolio provides the highest possible return (). -
Minimum Risk for a Given Level of Return :
For a specific level of return (), an efficient portfolio minimizes the risk ().
- Optimization Process :
To identify efficient portfolios, investors use mathematical optimization techniques to solve for weights () that maximize return or minimize risk under constraints such as:
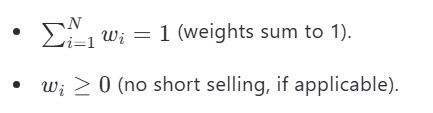
3. Utility Curves and Their Impact on Optimal Portfolio Selection
Utility Curves represent an investor's preferences for risk and return. Each curve corresponds to a specific level of utility (satisfaction) for the investor, based on their risk tolerance.
-
Key Points :
- Investors aim to select a portfolio that maximizes their utility.
- The optimal portfolio lies at the point where the investor's utility curve is tangent to the efficient frontier.
- More risk-averse investors will choose portfolios closer to the minimum variance portfolio, while less risk-averse investors will choose portfolios farther along the efficient frontier.
-
Graphical Representation :
- Utility curves are upward-sloping and convex to the x-axis.
- The tangency point between the utility curve and the efficient frontier identifies the optimal portfolio for the investor.
4. Capital Market Line (CML) and Its Relationship with Efficient Portfolios and the Risk-Free Asset
The Capital Market Line (CML) is a key concept in modern portfolio theory that incorporates the risk-free asset into the efficient frontier.
-
Definition :
The CML represents all possible combinations of the risk-free asset and the market portfolio (the optimal risky portfolio). It shows the trade-off between risk and return for these combinations.
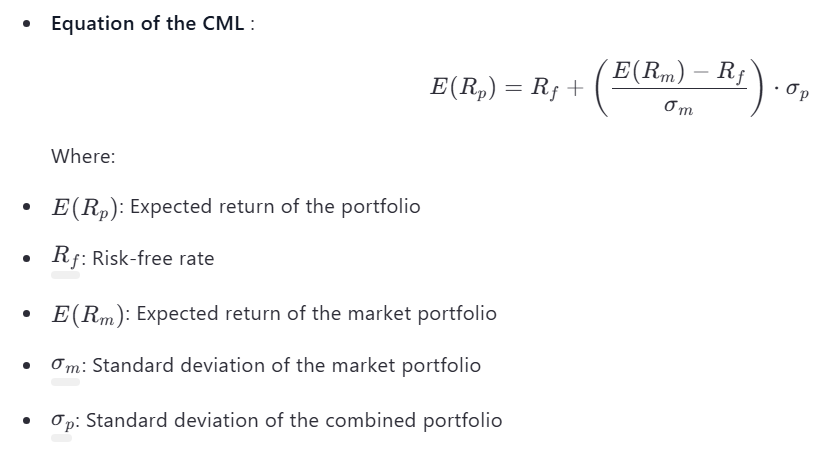
Equation of the CML :
-
Key Features :
- The slope of the CML is called the Sharpe Ratio , which measures the excess return per unit of risk.
- The CML starts at the risk-free rate () on the y-axis and passes through the market portfolio on the efficient frontier.
- Portfolios along the CML dominate those below it, as they offer better risk-return trade-offs.
-
Impact of the Risk-Free Asset :
Including the risk-free asset allows investors to create leveraged portfolios (borrowing at to invest more in the market portfolio) or conservative portfolios (lending at ). This shifts the efficient frontier from a curve to a straight line (the CML).
5. Practical Examples and Calculations
Example 1: Identifying an Efficient Portfolio
Suppose you have two assets:
- Asset A: ,
- Asset B: ,
- Correlation () = 0.5
Step 1: Calculate Portfolio Weights for Minimum Variance
Using optimization techniques, find weights and that minimize portfolio variance. Assume and .
Step 2: Calculate Portfolio Return and Risk
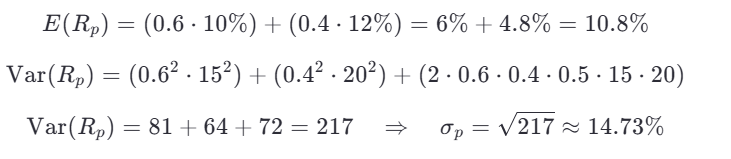
This portfolio lies on the efficient frontier.
Example 2: Capital Market Line
Given:
-
-
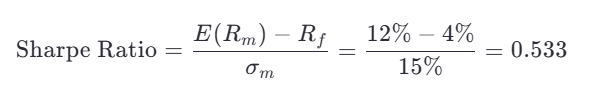
Market Portfolio: ,
Step 1: Calculate Sharpe Ratio
Step 2: Determine Portfolio Return for
Key Takeaways
- Efficient Frontier : Represents portfolios that maximize returns for a given level of risk or minimize risk for a given level of return.
- Utility Curves : Help investors identify their optimal portfolio based on risk preferences.
- Capital Market Line (CML) : Incorporates the risk-free asset and provides superior risk-return combinations.
- Practical Application : Understanding these concepts enables investors to construct optimal portfolios tailored to their risk tolerance and return objectives.